Introduction
The stock market can be an intimidating place for beginners, but understanding how to analyze stock market trends is key to making informed investment decisions. Whether you’re looking to grow your wealth over time or make short-term trades, this step-by-step guide will help you grasp the basics of stock market analysis and equip you with the tools to navigate the market confidently.
1. Understanding Stock Market Trends
Stock market trends are patterns or directions in which the stock market moves over time. Trends can be upward (bullish), downward (bearish), or sideways (neutral). Recognizing these trends early can help you make profitable investment decisions. The three main types of trends to understand are:
- Short-Term Trends: Last from a few days to a few weeks.
- Intermediate-Term Trends: Last from a few weeks to a few months.
- Long-Term Trends: Last from several months to years.
2. Key Indicators for Analyzing Stock Market Trends
To effectively analyze stock market trends, you need to familiarize yourself with key indicators. These indicators provide insights into market conditions and potential future movements. The most commonly used indicators include:
a. Moving Averages
- What It Is: A moving average smooths out price data by creating a constantly updated average price. There are two main types: Simple Moving Average (SMA) and Exponential Moving Average (EMA).
- How to Use: Moving averages help identify the direction of the trend. A rising moving average indicates an uptrend, while a falling moving average suggests a downtrend. When the price crosses above the moving average, it may signal a buy, and when it crosses below, it may signal a sell.
b. Relative Strength Index (RSI)
- What It Is: The RSI is a momentum oscillator that measures the speed and change of price movements on a scale of 0 to 100.
- How to Use: An RSI above 70 indicates that a stock is overbought and might be due for a correction, while an RSI below 30 suggests that a stock is oversold and could be due for a rebound.
c. Moving Average Convergence Divergence (MACD)
- What It Is: MACD is a trend-following momentum indicator that shows the relationship between two moving averages of a stock’s price.
- How to Use: When the MACD line crosses above the signal line, it may indicate a bullish signal, and when it crosses below, it may indicate a bearish signal.
d. Volume
- What It Is: Volume measures the number of shares traded in a stock or market.
- How to Use: High volume during a price movement indicates strong momentum and can confirm the direction of the trend. Low volume may signal weakness in the trend.
3. Fundamental Analysis vs. Technical Analysis
Stock market analysis typically falls into two categories: fundamental analysis and technical analysis. Understanding the differences between these approaches can help you choose the right strategy for your investments.
a. Fundamental Analysis
- What It Is: Fundamental analysis involves evaluating a company’s financial health and business prospects to determine its intrinsic value.
- Key Metrics: Earnings per share (EPS), price-to-earnings ratio (P/E), revenue growth, dividend yield, and debt-to-equity ratio.
- Use Case: Ideal for long-term investors who focus on a company’s financial stability and potential for growth.
b. Technical Analysis
- What It Is: Technical analysis focuses on historical price and volume data to forecast future price movements.
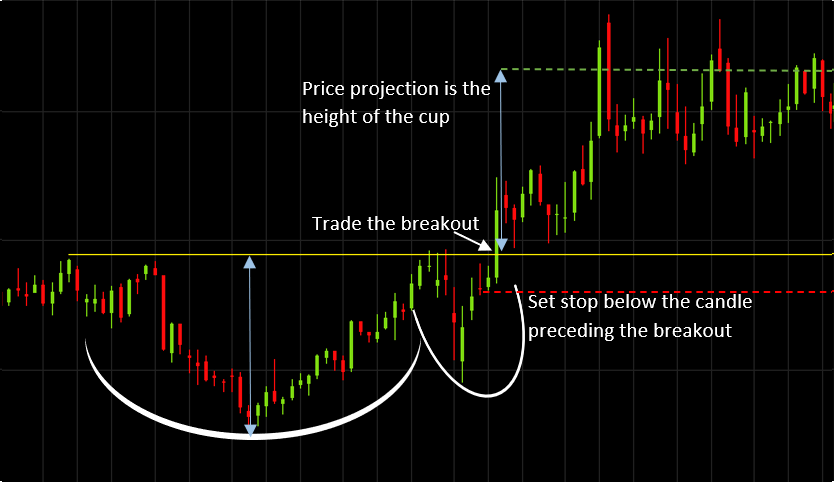
- Key Tools: Charts, trendlines, indicators like RSI and MACD, and patterns such as head and shoulders or double bottoms.
- Use Case: Commonly used by short-term traders to identify entry and exit points based on market behavior.
4. Step-by-Step Guide to Analyzing Stock Market Trends
Step 1: Define Your Investment Goals
- Before diving into market analysis, clearly define your investment goals. Are you investing for long-term growth, income, or short-term gains? Your goals will influence the type of analysis you prioritize.
Step 2: Conduct Technical Analysis
- Use the key indicators discussed above (moving averages, RSI, MACD, and volume) to analyze stock charts. Look for patterns and signals that indicate potential buy or sell opportunities.
Step 3: Perform Fundamental Analysis
- Analyze the company’s financial statements, earnings reports, and industry position. Consider factors like revenue growth, profit margins, and competitive advantages. Compare the company’s valuation metrics to industry averages.
Step 4: Monitor Economic and Market News
- Stay informed about broader economic trends, such as interest rates, inflation, and geopolitical events, which can impact market conditions. Follow financial news outlets and market reports regularly.
Step 5: Use a Stock Screener
- Stock screeners allow you to filter stocks based on specific criteria, such as P/E ratio, dividend yield, or market capitalization. Use these tools to narrow down potential investments that match your strategy.
Step 6: Make Informed Decisions
- Based on your analysis, decide whether to buy, hold, or sell. Consider your risk tolerance and investment horizon. Don’t let emotions drive your decisions—stick to your analysis and investment plan.
5. Common Mistakes to Avoid in Stock Market Analysis
Even experienced investors can make mistakes. Here are some common pitfalls to avoid:
- Overtrading: Frequent buying and selling can lead to higher transaction costs and lower returns. Stick to your plan and avoid impulsive trades.
- Ignoring Fundamentals: Even if you’re focused on technical analysis, don’t ignore the company’s fundamentals. A strong trend can quickly reverse if the underlying business is weak.
- Failing to Diversify: Don’t put all your eggs in one basket. Diversify your portfolio across different sectors and asset classes to mitigate risk.
- Chasing Trends: Avoid the temptation to jump on the latest trend or hot stock without proper analysis. FOMO (fear of missing out) can lead to poor investment decisions.
Conclusion
Analyzing stock market trends is an essential skill for any investor. By understanding key indicators, distinguishing between fundamental and technical analysis, and following a structured approach, you can make more informed investment decisions. Remember, successful investing requires patience, discipline, and a willingness to learn from your experiences. Start analyzing stock market trends today, and you’ll be better equipped to achieve your financial goals.